Reading the DISC Graph
There is no u201ccorrectu201d score to have. Each personal style is a unique blend of D, I, S and C. Use the graph on the Results Summary page or the Your DISC Results as the main point of reference. This graph describes how you tend to behave naturally in non-stressful conditions. Each colored bar has a meaning. To read the graph start with the red u201cDu201d bar on the top and end with the blue u201cCu201d bar on the bottom.
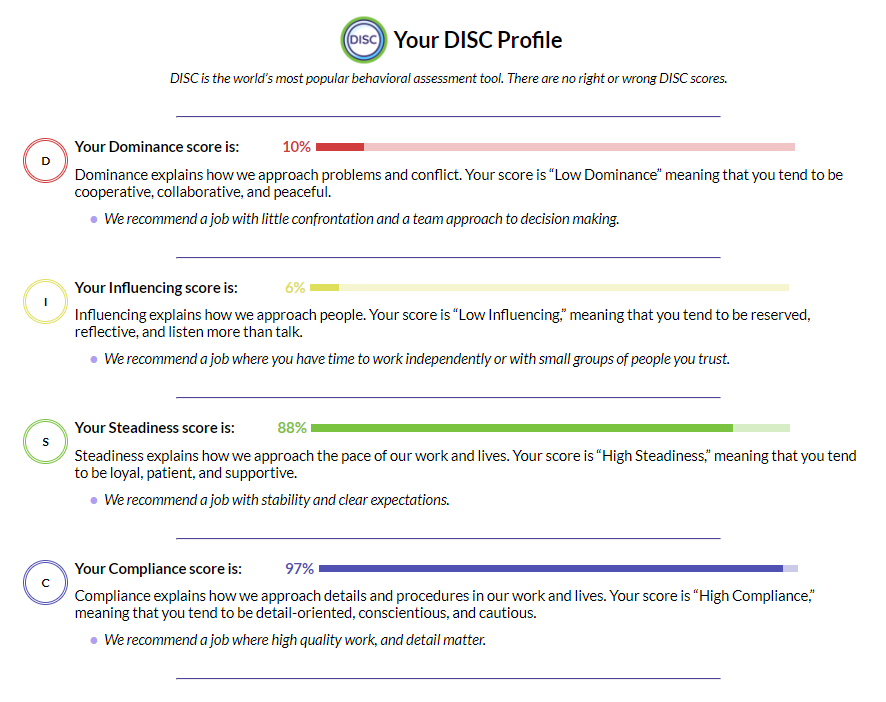
Letu2019s go over how to read your DISC scores.
nYour DISC scores each fall somewhere between 0-100, and are indicated by a colored bar with your numerical score listed to the left. Your score indicates which behaviors come more naturally to you.
nOn the DISC graph, scores above 50 are u201cHighu201d in that behavioral style. Scores below 50 are u201cLowu201d. How High or Low the score is shows how strongly that attribute is or is not displayed in your behavior and communication style. Another way to look at this is that the scores the furthest away from the u201c50u201d are the most pronounced behavioral traits for a person (u201cHighu201d or u201cLowu201d). If scores are toward the middle, it means that this personu2019s style in the given category tends to be more moderate, allowing them to easily adapt to different styles.
nThe most important thing to know when it comes to behaviors is: There is no wrong or right style. A high Dominance score is not better or worse than a low Dominance score, and vice versa. In the same vein, people with more extreme scores are not more u201cspecialu201d than people whose scores hover closer to the 50 line (average). Humans are incredibly unique; every type of combination is necessary and valuable.